Fact Check 15: The US national debt is skyrocketing, and we're having to borrow just to make the interest payments alone
How long could you survive if you take out loan after loan to spend more than you earn, every year? Not long. Neither will America, if we don't enact policies to combat our debt crisis -- fast.
Also see
2024 Fact Check: Introduction - by Jon Sutz
Source
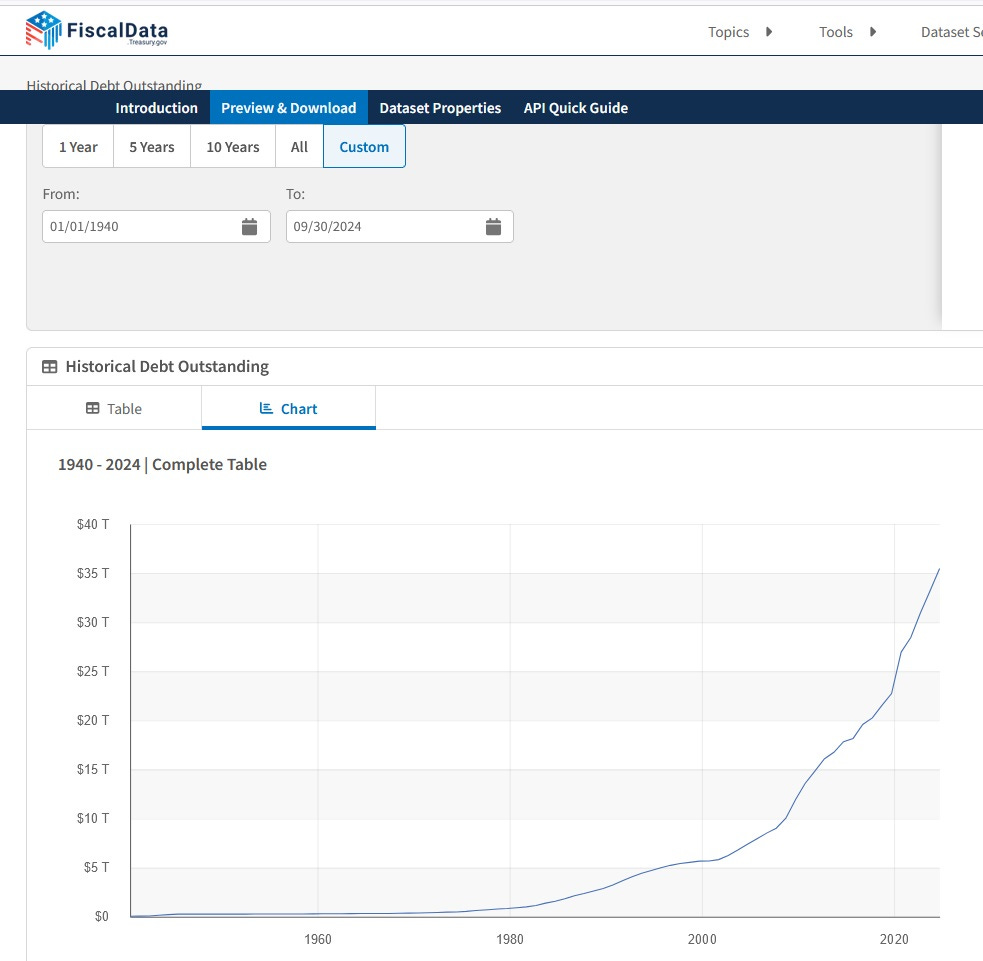
U.S. Department of the Treasury and Bureau of the Fiscal Service, “Historical Debt Outstanding” (use Custom field to enter date range 1940-2024):
Analysis
Some of my 2024 Fact Check infographic reports are simple, and short, because they discuss only one measurable data point that’s not in dispute.
Some, however, like this one, are far more complex, and require deeper analysis to inform the American people of issues and concepts they know little or nothing about, and which our “news” media doesn’t report.
The federal debt and spending crisis is one of those issues, that requires a bit of a “crash course” for the layperson, so they can understand the devastation to which America is headed, fast. I’ve done my best to make this simple and accountable, to the best of my knowledge. - J
The first thing to know about America’s spiraling debt crisis is that our federal government has no money; “government money” is a myth. The only money the US government possesses is:
That which it forces out of individual citizens, mostly via income taxes
That which it acquires from corporate taxes, import duties, excise and estate taxes
That which it borrows, which we, and our children and grandchildren, will have to pay back, out of future earnings
America’s debt must be viewed in two ways:
Total debt: The raw dollar amount of our outstanding debt, and unfunded liabilities (future spending to which Congress is committed; discussed in a moment)
Debt as a percentage of our gross domestic product: Known as the “GDP,” meaning the total value of all the work output of the American people
To put all this in a personal context:
The total debt America owes can be compared to the total balance on your current contractual obligations, including your mortgage, credit card bills, medical debt, etc.
Debt as a percentage of GDP can be compared to your total debt as a percentage of your total annual income
America’s debt today
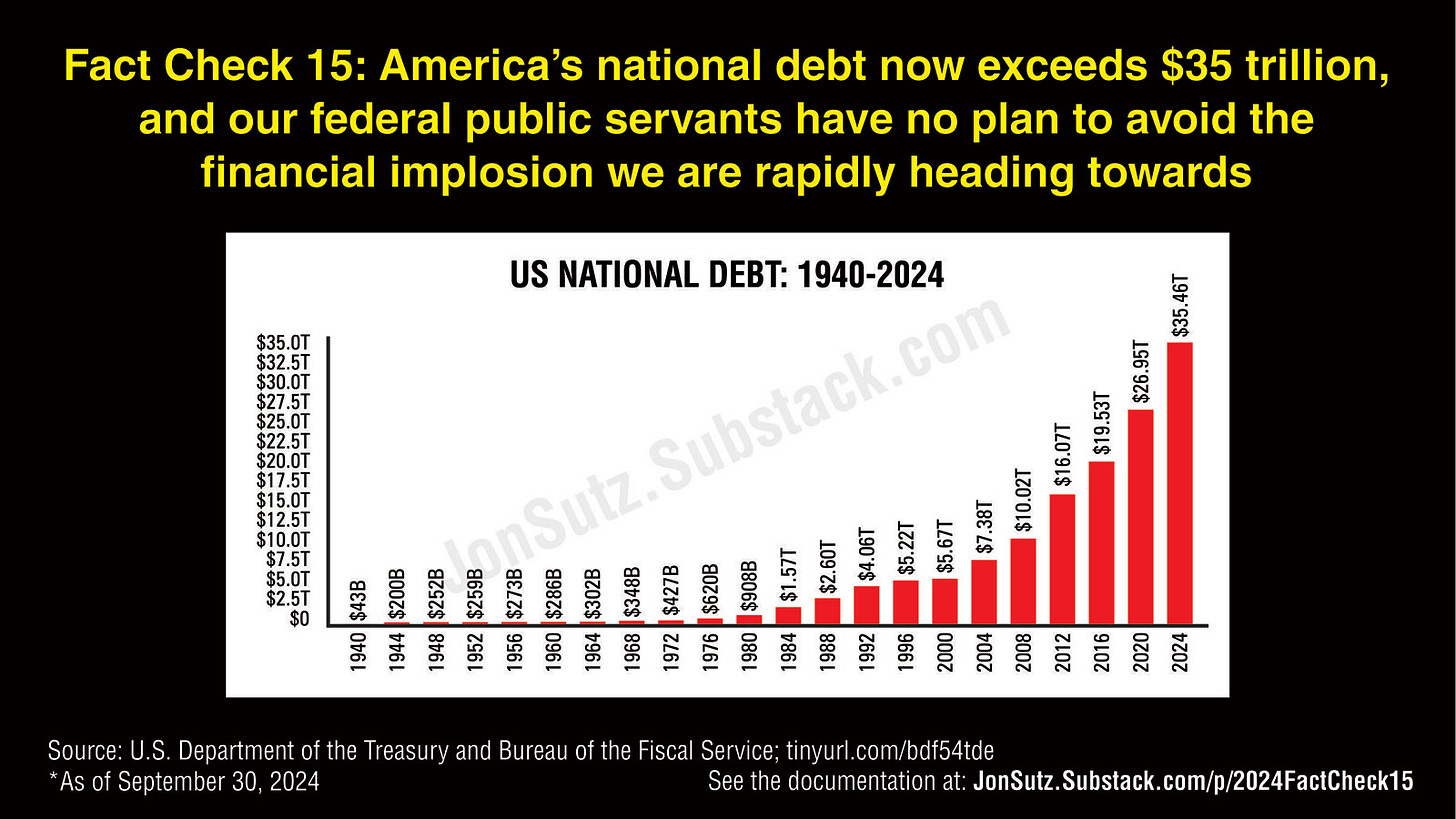
As of October 2024, America’s national debt stands at $35.46 trillion. This amount represents the accumulated total borrowing that the US government has done, each year, to enable it to spend more than it takes in through tax revenue:
How much is $1 trillion?
Before we proceed to the specifics of how America is borrowing-and-spending its way to a financial implosion, let’s gain a common conceptual understanding of what one trillion dollars actually means — in less than 3 minutes:
The US government is now borrowing almost one-third of its annual spending
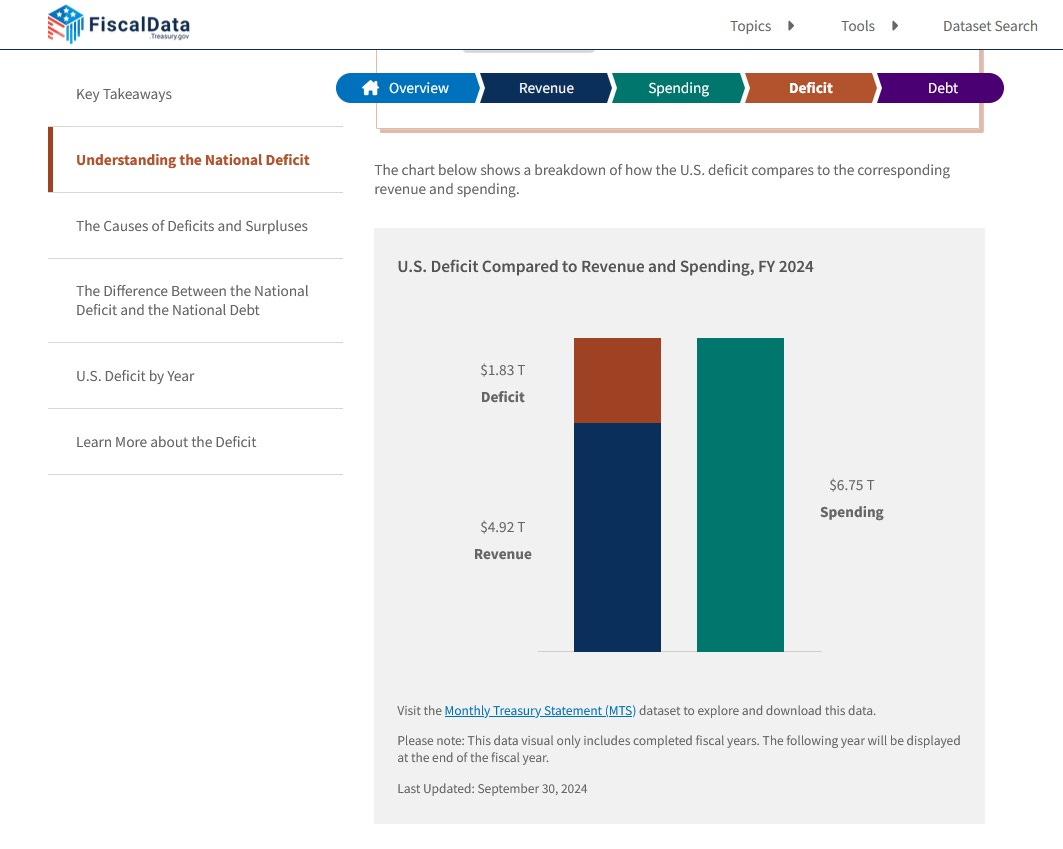
This chart, from the Department of the Treasury, shows that the US government in 2024 spent $6.75 trillion, but only received $4.92 trillion in tax revenue, meaning it borrowed $1.83 trillion to fill the gap — which is called the “deficit”:
This represents 36.9% of the US budget.
Converted to a personal basis, this is the equivalent of having a job that pays you $100,000 a year, but you are spending $136,900 a year — meaning each year, you are borrowing $36,900 to meet your spending desires.
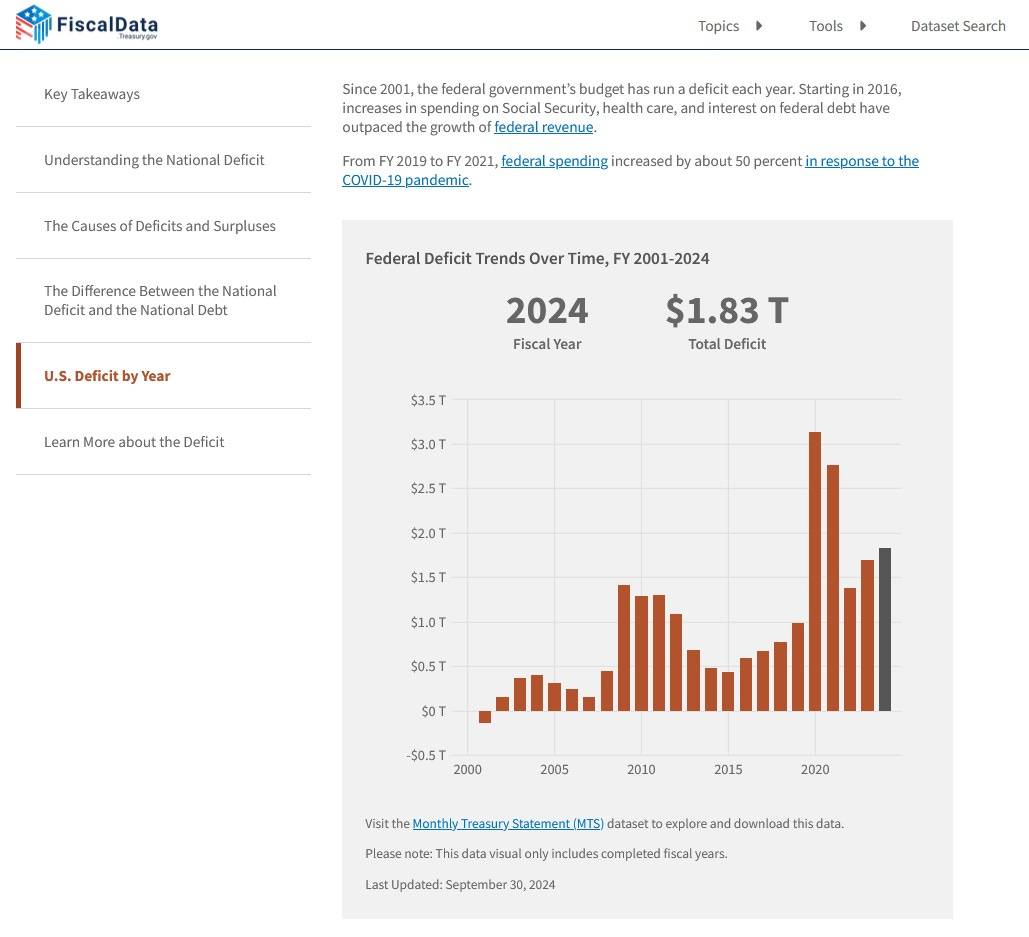
2024 was no exception — here are the deficit amounts the US government had to borrow to fill each year since 2001, according to the Department of Treasury:
The accumulation of all this deficit borrowing constitutes the total national debt.
The annual interest payments alone on the US national debt exceeds every budget item except Social Security
America’s debt consists of (a) the borrowed amount, (b) the interest rate at which the money was borrowed, and (c) the accumulation of both, over time. At present, the US government is doing nothing to actually pay down the debt. All we’ve been doing for decades has been to struggle to pay the interest portion alone; the principal amount keeps growing, and growing, and growing.
In 2024, interest on our debt grew 34 percent from 2023, to $950 billion.
Today, interest on the US debt is so large that it has become our second largest budget item, after Social Security. We are now spending more just to pay the interest on the national debt than we spend on the Department of Defense, or Medicare. According to the nonpartisan Tax Foundation (emphasis added), our debt and deficit have grown so large we are now in “uncharted territory”; this is bureaucracy-speak for, “Every danger light is flashing, and we damned well better start paying attention to it, right now, to avoid a disaster”:
A major source of the growing deficit is net interest on the public debt, which grew 34 percent to $950 billion in FY24. Interest on the debt is now the second largest federal expenditure after Social Security, which costs $1.5 trillion, surpassing defense spending of $826 billion and Medicare spending of $869 billion. As currently measured, interest paid on the debt in FY24 was about 3.3 percent of GDP, which (after adjustments for comparability) would be the highest since 1992 and nearly the highest in records going back to 1940. Interest on the debt as a share of GDP is set to enter unchartered territory in the new fiscal year, surpassing the high-water mark set in the early 1990s.
Where does this end, if we don’t demand that our elected federal officials develop a realistic plan by which to pay down America’s national debt?
The answer is: It ends with the economic collapse of America, and as a result, the collapse of other nations around the world. For a primer on this, see:
Here’s what would happen to the global economy if the U.S. defaults on its debt, PBS News, May 22, 2023. Excerpt:
If the debt crisis roiling Washington were eventually to send the United States crashing into recession, America’s economy would hardly sink alone.
The repercussions of a first-ever default on the federal debt would quickly reverberate around the world. Orders for Chinese factories that sell electronics to the United States could dry up. Swiss investors who own U.S. Treasurys would suffer losses. Sri Lankan companies could no longer deploy dollars as an alternative to their own dodgy currency.
“No corner of the global economy will be spared’’ if the U.S. government defaulted and the crisis weren’t resolved quickly, said Mark Zandi, chief economist at Moody’s Analytics.
We're having to borrow just to make the interest payments alone
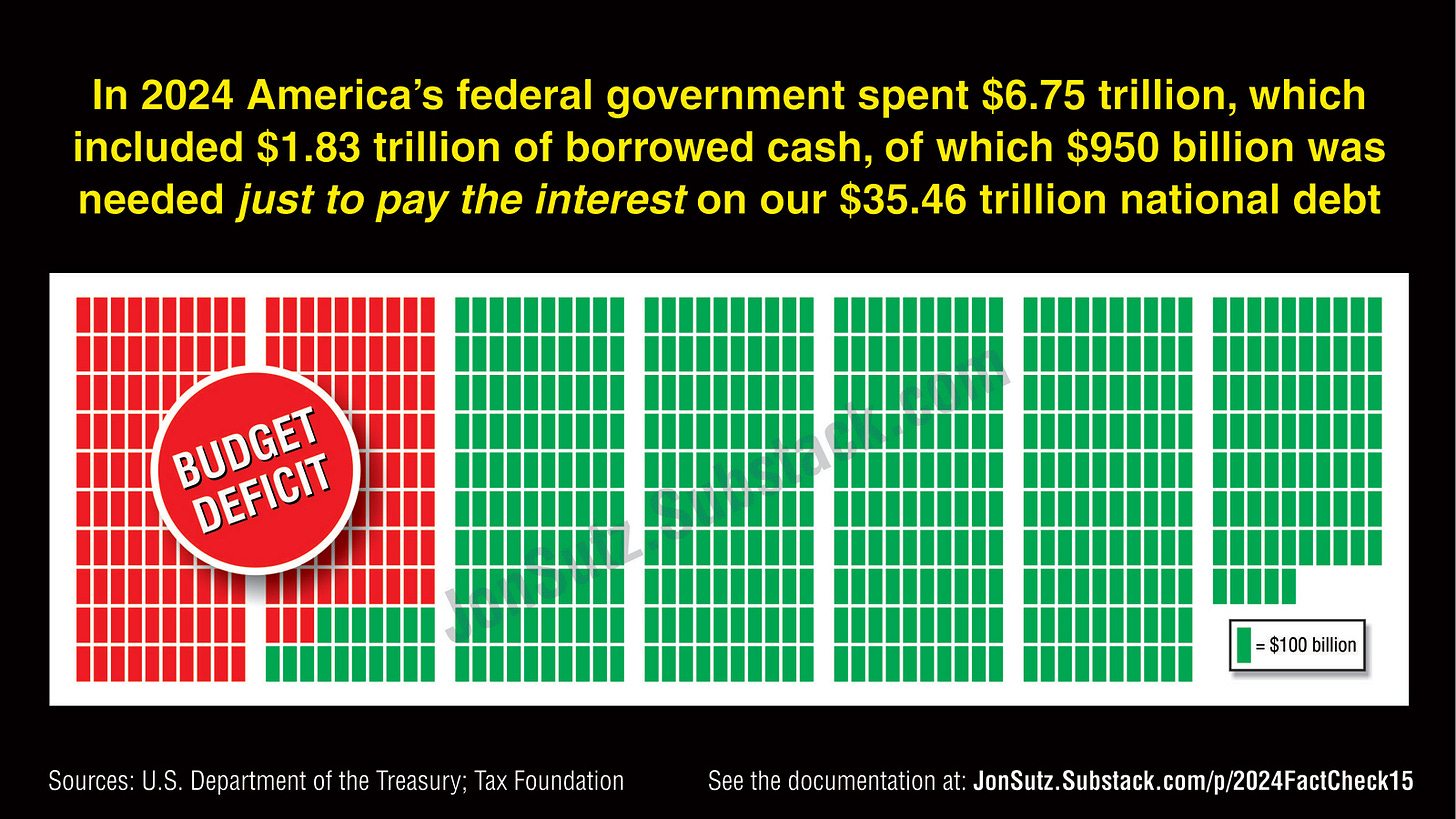
The annual interest payment on America’s national debt in 2024 alone was $950 billion.
As noted earlier, in 2024, our government borrowed $1.83 trillion more than it took in via tax revenues, to meet its spending obligations.
This means that almost half of the money the US government is borrowing, is only to pay the interest on our outstanding debt.
To explain the unsustainable insanity that is US federal spending, and put all these numbers together into one place, I created this infographic:
To put it in personal terms, if you keep borrowing to spend more than you earn, and keep using credit cards to cover your living expenses, you will eventually borrow just to pay the interest, while the principal keeps growing, and growing, and growing, until you meet the fate you deserve, as a result of your reckless personal finance habits.
But in that scenario, only you are affected.
If you are an officer in a public corporation, with shareholders to answer to, and you do this, year after year, you might well end up in jail, for fraud.
But if you are an elected public servant, and you do this to the American people — present and future — the worst negative consequence you face is losing your re-election bid.
How much of this debt is owed by each American citizen?
As of October 19, 2024, America’s national debt stood at $35,769,283,850,196.
If we divided this debt equally among us, every American — of all ages — individually owes $106,134. See the updated daily total of debt, and individual Americans’ share of it, at the Peter G. Peterson Foundation’s National Debt Clock.
And that’s just what we’ve allowed Congress and successive presidents to commit us to, under existing laws.
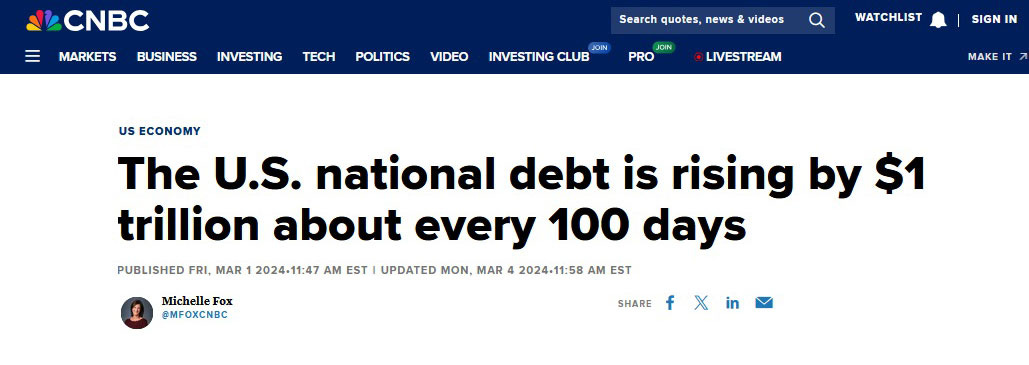
Today’s Congress, and spending commitments enacted by previous ones, are adding $1 trillion to our national debt every 100 days:
Source: CNBC, March 1, 2024, citing data from US Dept of Treasury.
America’s debt as a percentage of GDP is higher than any point since the all-out spending required for America to win World War 2
To put this into context, in 2020, the US national debt was higher, as a percentage of GDP, than at any time since the peak of America’s all-out effort to win World War 2.
Source: Federal Reserve Bank of St. Louis, citing U.S. Office of Management and Budget debt to gross domestic product ratios data, 1940-2024.
And then there’s the $220 trillion in unfunded liabilities — money we’ve allowed Congress to commit us to spending in the future
Translating this into a personal realm, imagine if, after borrowing more than your family makes each year to meet current spending commitments, you discover your spouse also signed contracts to spend nearly 7 times your current expenditures in the future.
To get an up-to-the-second accounting of all this, see the US Debt Clock. At the top left it shows the current state of our debt. At the bottom it right shows “Unfunded Liabilities,” meaning spending commitments we’ve allowed Congress to make, stretching out decades in the future. As of October 19, 2024, our unfunded liabilities total $220 trillion — almost 7 times our current debt:
What would Harris’s and Trump’s spending and tax policies do to America’s economy, and our debt crisis?
I am not an expert on what resource has been the most accurate in predicting the impacts of various presidents’ and Congressional spending and tax proposals. That said, over the years I’ve seen people and organizations I respect refer to the Tax Foundation as the most responsible “scorer” of proposed spending and tax policies.
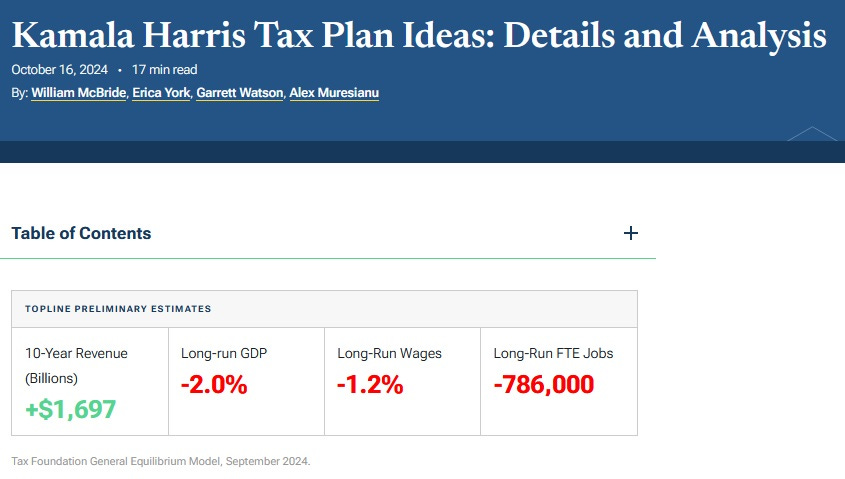
In its final reports before the 2024 election, for Harris’s and Trump’s proposals, the Tax Foundation indicates:
Harris report: Her policies would increase tax revenue, but cause a decline in America’s, worker wages, and full-time employment (FTE)
Trump report: His policies would reduce tax revenue, but increase America’s GDP, wages and full-time employment (FTE):
Some suggest that the Congressional Budget Office (CBO) is also a reliable scorer of federal spending and tax proposals, and it’s my understanding that 50~ years ago, that was the case. Since then, however, there are substantive arguments that show its calculations are slanted to support leftist proposals, including through what’s called “static” instead of “dynamic scoring. What this means, in summary:
Static scoring: If Candidate X, a Democrat (or “Democratic Socialist”) proposes a plan that would increase the taxes on “the rich” and corporations, that based on past revenues, it plots how much more the US Treasury will receive
“Dynamic” scoring: Takes into account the fact that human beings, individually and collectively (as in corporations), react to proposed and active federal spending and tax proposals, in often specific, predictable ways. And if they are being targeted for higher taxes, they will often redirect their money and efforts to places where both will be protected, and produce the highest return — which is often in other nations.
To learn more, see this overview from Investopedia.
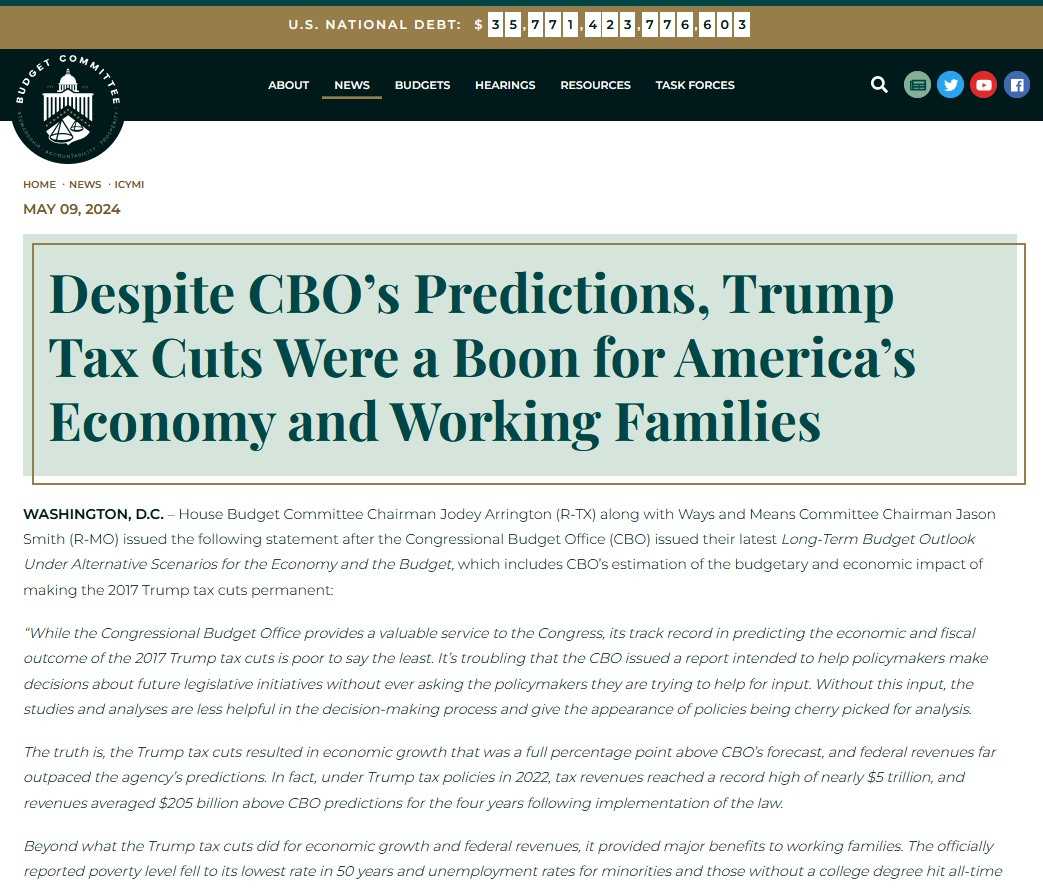
A case in point for this allegation against the CBO was released in May 2024 by the (Republican-controlled) Congress, showing that contrary to predictions, Trump’s Tax Cuts and Jobs Act actually produced a torrent of benefits for America’s economy and workers, at all levels:
Despite CBO’s Predictions, Trump Tax Cuts Were a Boon for America’s Economy and Working Families, Congressional Budget Committee, May 9, 2024
A special obscenity: Much of America’s current and future debt is being incurred to provide an A-Z variety of “free” values to tens of millions of illegal aliens — and Harris promises to increase this phenomenon, if she is elected President
With all the above in mind, consider now the staggering amount of money the Biden-Harris administration has been taxing us, and borrowing, to provide “free” things to the estimated 22 million illegal aliens* now living on US soil — and how much more her plans will cost us, if she is elected President. (*According to Sen. Charles Schumer (D-NY) and many other top Democrats, in the recent past, the proper, legal definition for anyone who unlawfully enters American territory is “illegal alien.”)
According to the Foundation for Government Accountability and other watchdogs, Harris supports a policy that President Biden enacted in October 2024, that will in the near future force America to spend at least $150 billion to provide “free” health care to illegal aliens
As verified by various tax watchdogs — and even the far-left Snopes — Harris wants to use federal tax money to provide “free” sex change operations for illegal aliens who have been convicted of crimes, and are in US prisons and jails (more here)
According to the Congressional Budget Committee, Medicaid spending on illegal aliens during the Biden-Harris administration has cost taxpayers over $16.2 billion
As of 2018, roughly one in seven US births is by illegal aliens.
The estimated cost of illegal aliens to California taxpayers is $30 billion each year, which is nearly 18% of the state’s entire annual budget.
As of 2015, America spent an estimated $135 billion on illegal aliens, at the federal, state and local level. At the time, that was 1/30th, or 3.3% of our $4.1 trillion federal budget. One can only imagine what that percentage is, in 2024, after the Biden-Harris administration allowed an estimated 12 million more illegal aliens to enter America, and hooked them up with an A-Z of “free” values.
Also see:
SPECIAL REPORT: Democrats routinely employed what they now say is “white nationalist” language regarding border security, by Jon Sutz, January 14, 2019
Conclusion: How is it even possible, in 2024, that these issues are not front-and-center in the presidential and Congressional debates?
With each passing year, Americans benefit from dramatic advancements in many realms of life: our smartphones get smarter, our computers more powerful, our cars more efficient, our AI apps more awesome, etc.
And yet, how is it even possible, in 2024 America, that:
Neither Harris nor Trump have been publicly confronted with infographics as simple as those in this Fact Check, and asked what they’re going to do to avert the financial implosion to which America is now headed, at an increasing rate of speed?
Presidential debates are almost exclusively verbal, and moderated by one entity, that almost invariably tilts left, and that violates the agreed-to rules, to advance Democratic candidates’ interests?
It doesn’t have to be this way.
We can, and must, demand better.
And if America is to avert the debt crisis that our top federal public servants created, and that threaten our existence as a free, self-governing, prosperous, secure people, we damned well better get started demanding better from our “leaders,” and debate moderators, fast.
Subscribe
If you value the 2024 Fact Check infographic report series, subscribe below to receive each new one via email until Election Day, and share this post on social media:


